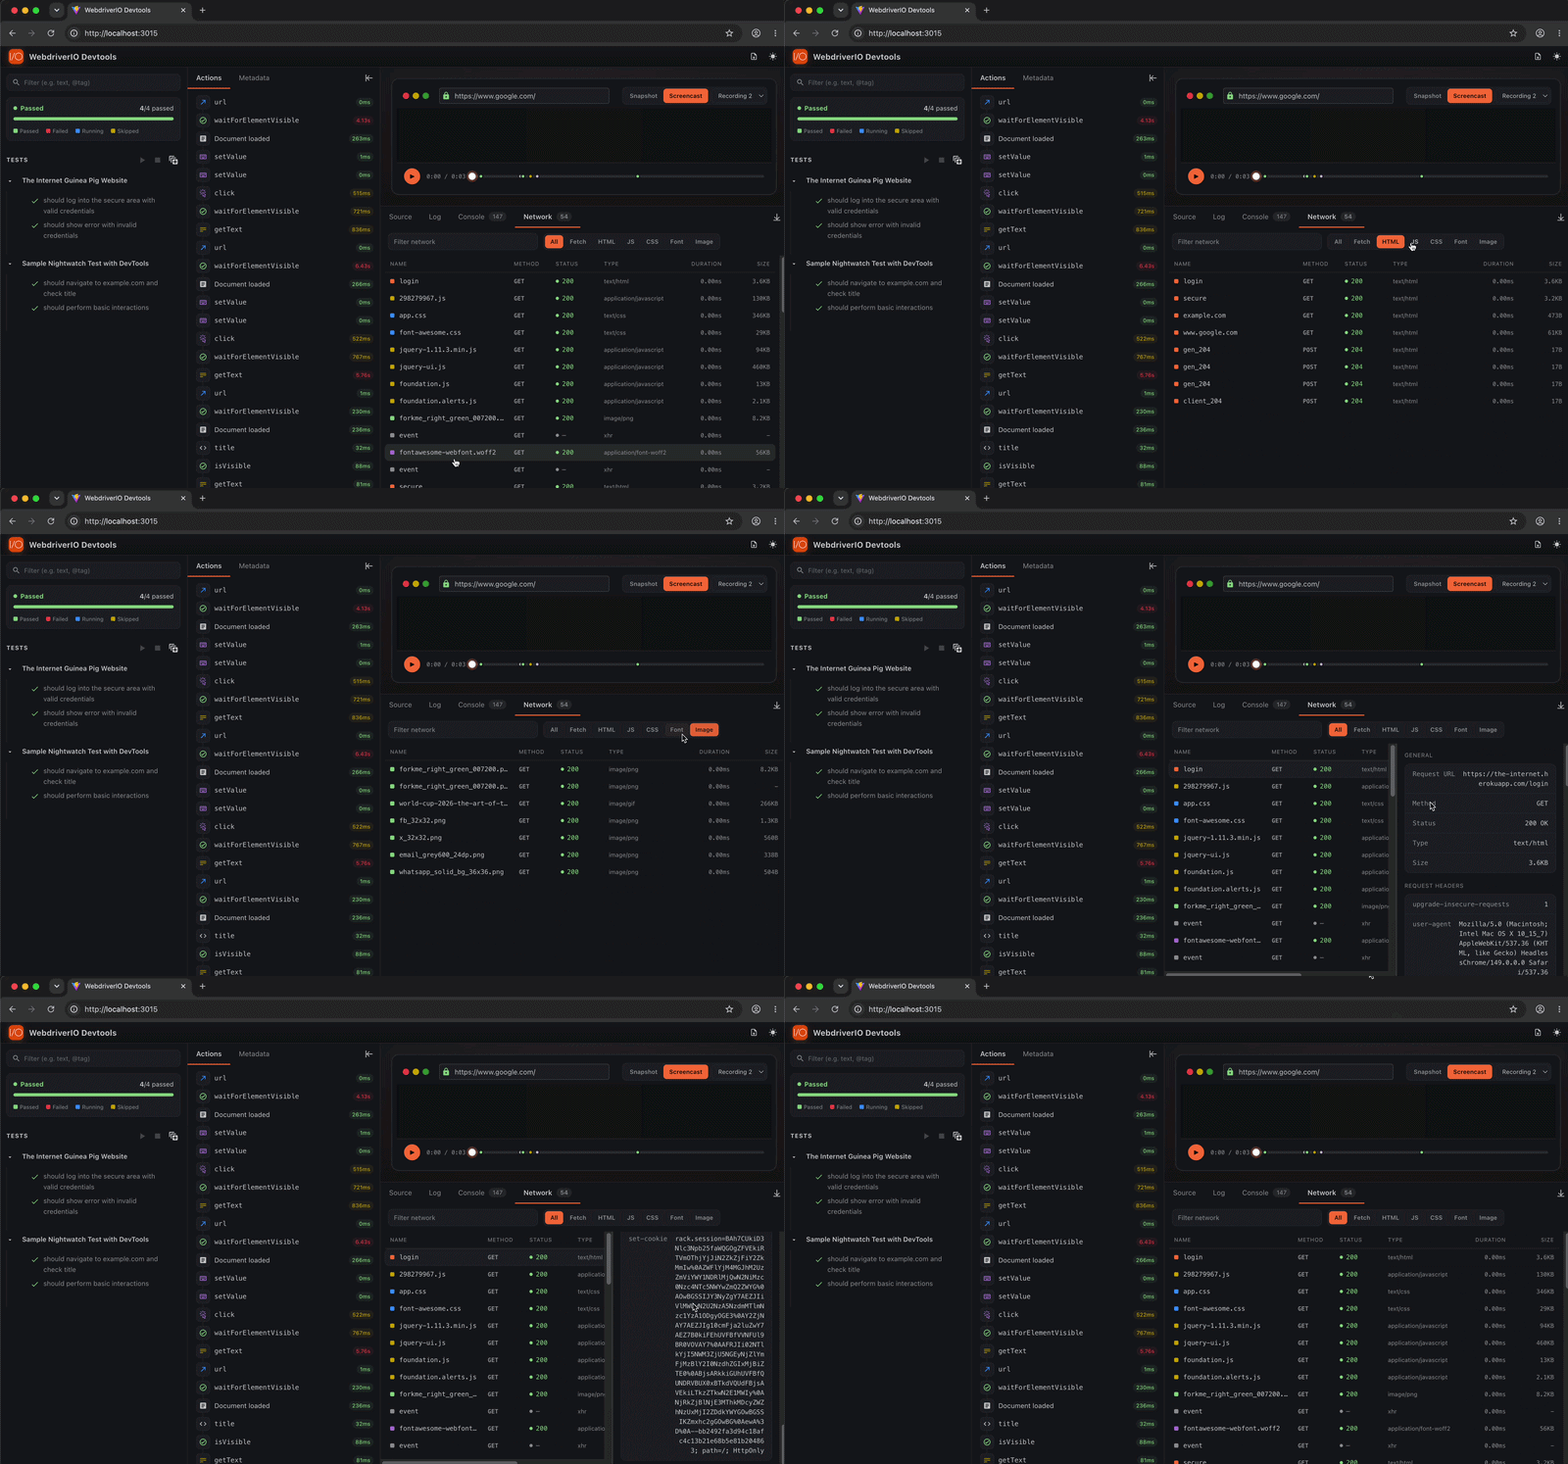
Network Logs
Monitor and inspect all network activity during your tests. DevTools captures every HTTP request and response, giving you complete visibility into API calls, resource loading, and network timing - just like browser DevTools.
What Gets Captured:
- Request details - URL, method, headers, query parameters, request body
- Response data - Status code, response headers, response body, timing
- Resource types - XHR/Fetch requests, scripts, stylesheets, images, and more
- Performance metrics - Request timing, duration, and network waterfall
This is invaluable for debugging API issues, identifying slow requests, validating data payloads, and understanding your application's network behavior during tests.
Without WebDriver BiDi
Safari and every session Appium serves (Safari on iOS, Chrome on Android) expose no WebDriver BiDi, so there the Network tab is filled by the page itself, through the same injected collector that records the DOM. It uses two sources of the page's own:
fetch/XMLHttpRequestpatch: each call the page makes carries its method, headers, status and body.- Resource Timing buffer: every load the browser made (the document, scripts, styles, images, fonts) with its timing phases and size, plus a status on Chromium. The buffer is read when the collector installs, so loads made before it existed are included.
Resource Timing cannot see headers or bodies, and on Safari it reports no status. Each such row says so in its detail card, a row with no status is coloured as unknown rather than as failed or still in flight, and the method column shows a dash where the browser names none. In a trace, the row's trace.network entry carries _source: "resource-timing" and the captured _resourceType, so a reopened trace renders the same row. A request both sources saw is listed once.
When BiDi is serving the session, meaning it has delivered a network event and not merely accepted a subscription, the Resource Timing rows are dropped so each request is listed once. On Nightwatch, the Chrome performance log upgrades those rows in place with the headers and status it has.
A native app session has no document, so neither source applies. Its network can be read from the appium-interceptor plugin instead when the session sets appium:intercept: true; see Native app network.
Demo
🌐 Network Logs