Trace Player
The show-trace player opens any trace produced in Trace Mode in the WebdriverIO DevTools UI itself — a dedicated, read-only player mode for offline replay, review, and AI-agent diffing.
Demo
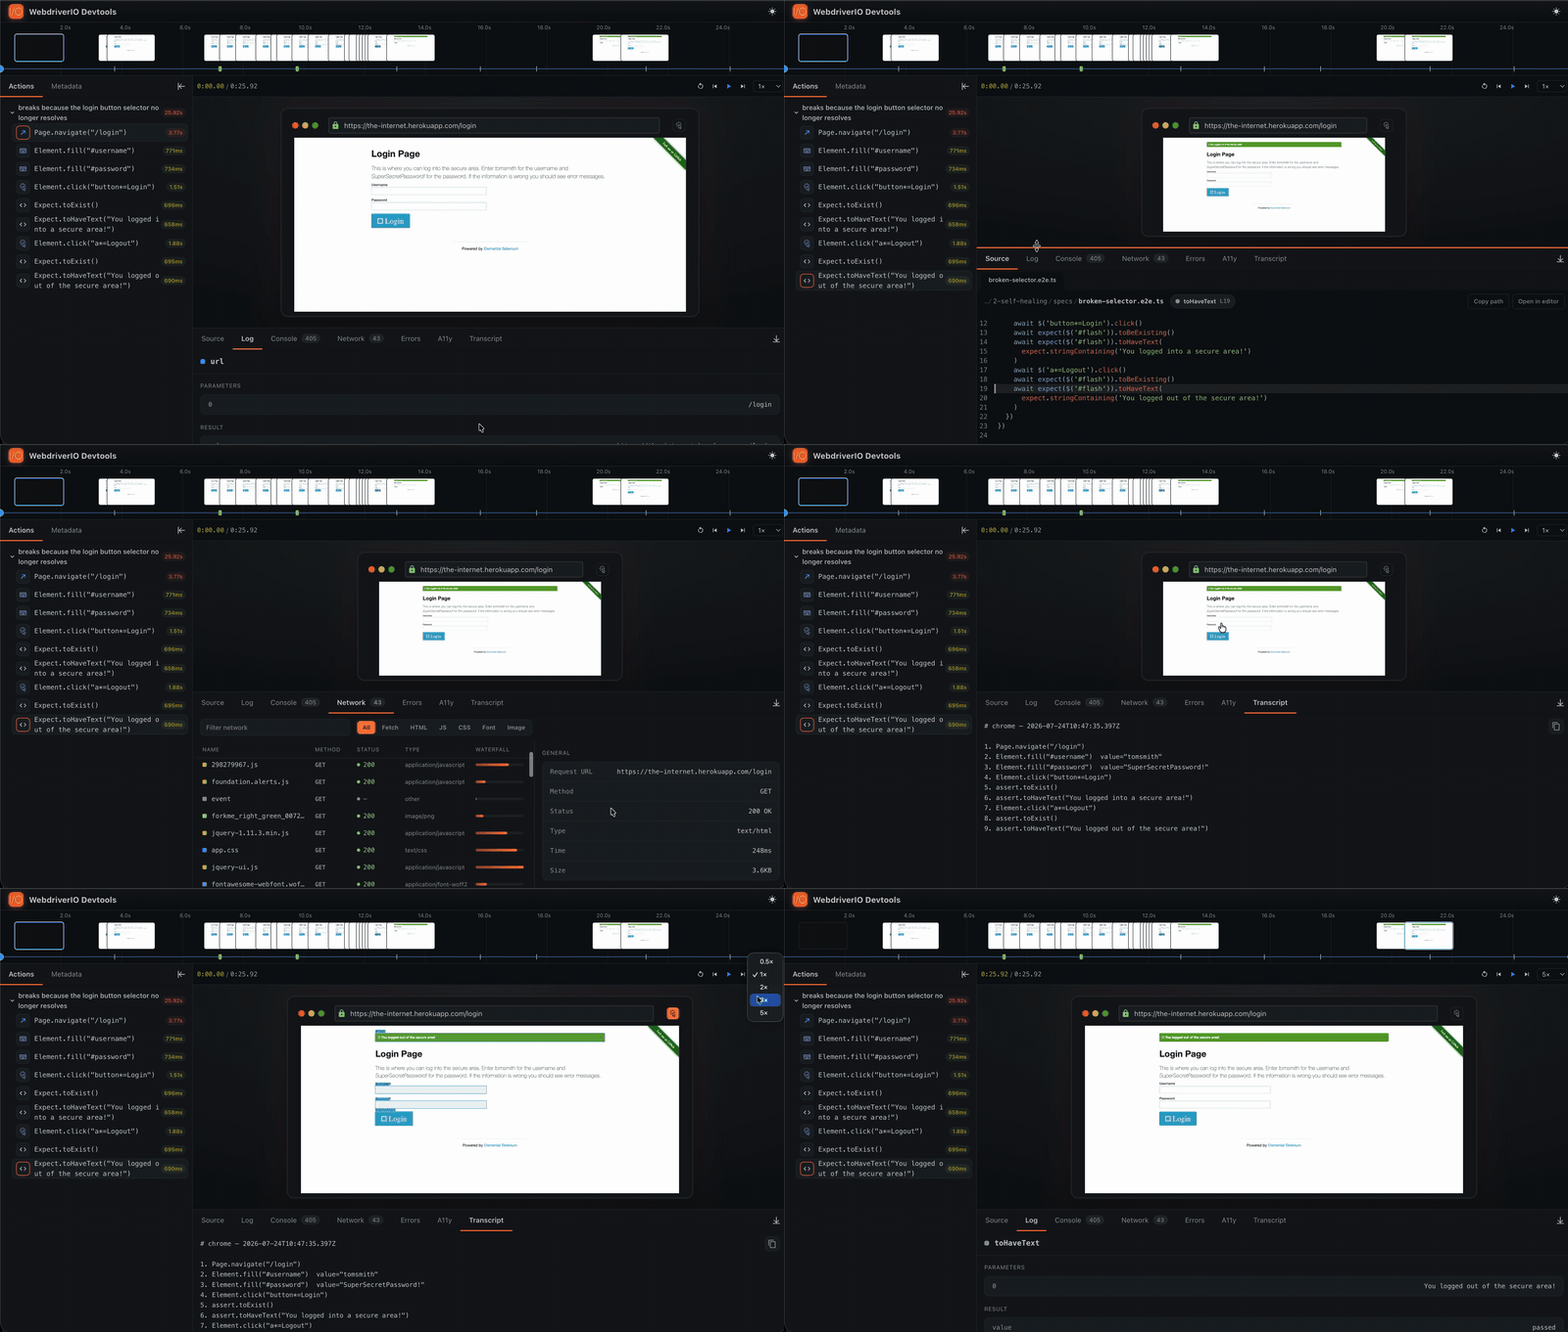
show-trace — the first-party player
Open a trace in the DevTools UI:
show-trace trace-<sessionId>.zip          # bin on PATH after install
npx show-trace trace-<sessionId>.zip      # or via npx
pnpm show-trace trace-<sessionId>.zip     # from the devtools monorepo
The show-trace bin ships with each adapter (@wdio/devtools-service, @wdio/nightwatch-devtools, @wdio/selenium-devtools), so it's available in any project that installs one — no extra dependency. It boots the same DevTools UI in a dedicated player mode and opens it in your browser:
- Action list (left) — the captured commands, with a Metadata tab alongside.
- Browser pane (centre) — the reconstructed page for the selected action (see DOM time-travel below). When the trace carries a filmstrip/video, a Snapshot / Screencast toggle switches to the recorded video.
- Timeline strip (top) — a filmstrip of thumbnails at their wall-clock positions plus a scrub bar with a draggable playhead. Click a thumbnail or drag anywhere to seek.
- Controls bar — play/pause, step, and speed.
- Dock tabs (bottom) — Source, Log, Console, Network, Errors (each badged with its count), plus the player-only A11y and Transcript tabs. Click a Network row for the request detail (headers, timing, status).
- Keyboard shortcuts —
Spaceplay/pause,←/→step between actions,Home/Endjump to first/last,,/.change speed,/focus filter,?show all shortcuts.
Accepts a
.ziponly. The same shortcuts work in the live dashboard (←/→walk the command list,?shows help).
Trace player features
Beyond static frame stepping, the player reconstructs and cross-references the run:
- DOM time-travel — the browser pane replays the captured DOM-mutation stream (and form field-state — input
value, checkboxchecked, including fields cleared back to empty) to rebuild the real DOM as of the selected action's time, not just a screenshot. Points that carry no captured frame (assertions, static waits) still show the true page state. - A11y tab + element overlay ("pick locator") — the A11y tab shows the accessibility tree (roles + accessible names) captured for the selected command. Toggle the element overlay in the browser chrome to outline every element the test interacted with; hover a box to highlight its row in the A11y tree, click to copy a resilient locator. The link is bidirectional — hovering a tree row highlights the element back in the snapshot.
- Transcript tab + Copy-for-LLM — the Transcript tab renders the run's
transcript.md(a human/LLM-readable summary in execution order). A one-click Copy bundles the transcript with any failing-command errors as paste-ready context for an LLM. - Timeline input markers — each action is marked on the scrub bar by kind: keyboard actions as a green bar, pointer actions (which carry a hit point) as a blue dot, others as a plain tick — so you can read the interaction rhythm at a glance.
- Cucumber nesting — Cucumber runs nest as Feature → Scenario → Step in the action tree, so steps sit under their scenario and feature.
- Dense filmstrip scrubbing — with
filmstripenabled, the timeline packs the dense frames for smooth scrubbing instead of one-frame-per-action jumps.
Other trace viewers
Because the artifact uses a portable, standard trace-viewer on-disk format, the same .zip (or directory) also opens in compatible standalone trace viewers, and — sharing that format — inside an Allure report's embedded trace viewer (Allure ≥ 2.35). They render:
- Timeline of actions with timings
- Per-action screenshots
- Element snapshots
- Network waterfall
- Console events
For LLM / agent consumption, read transcript.md directly — it's a tight Markdown rendering of the actions with selectors and values.
The trace pipeline (action-mapping, snapshot serializers, NDJSON writer, zip / directory writer) is shared across adapters via @wdio/devtools-core, so the artifact shape is identical no matter which adapter produced it — see Cross-Framework Support.
