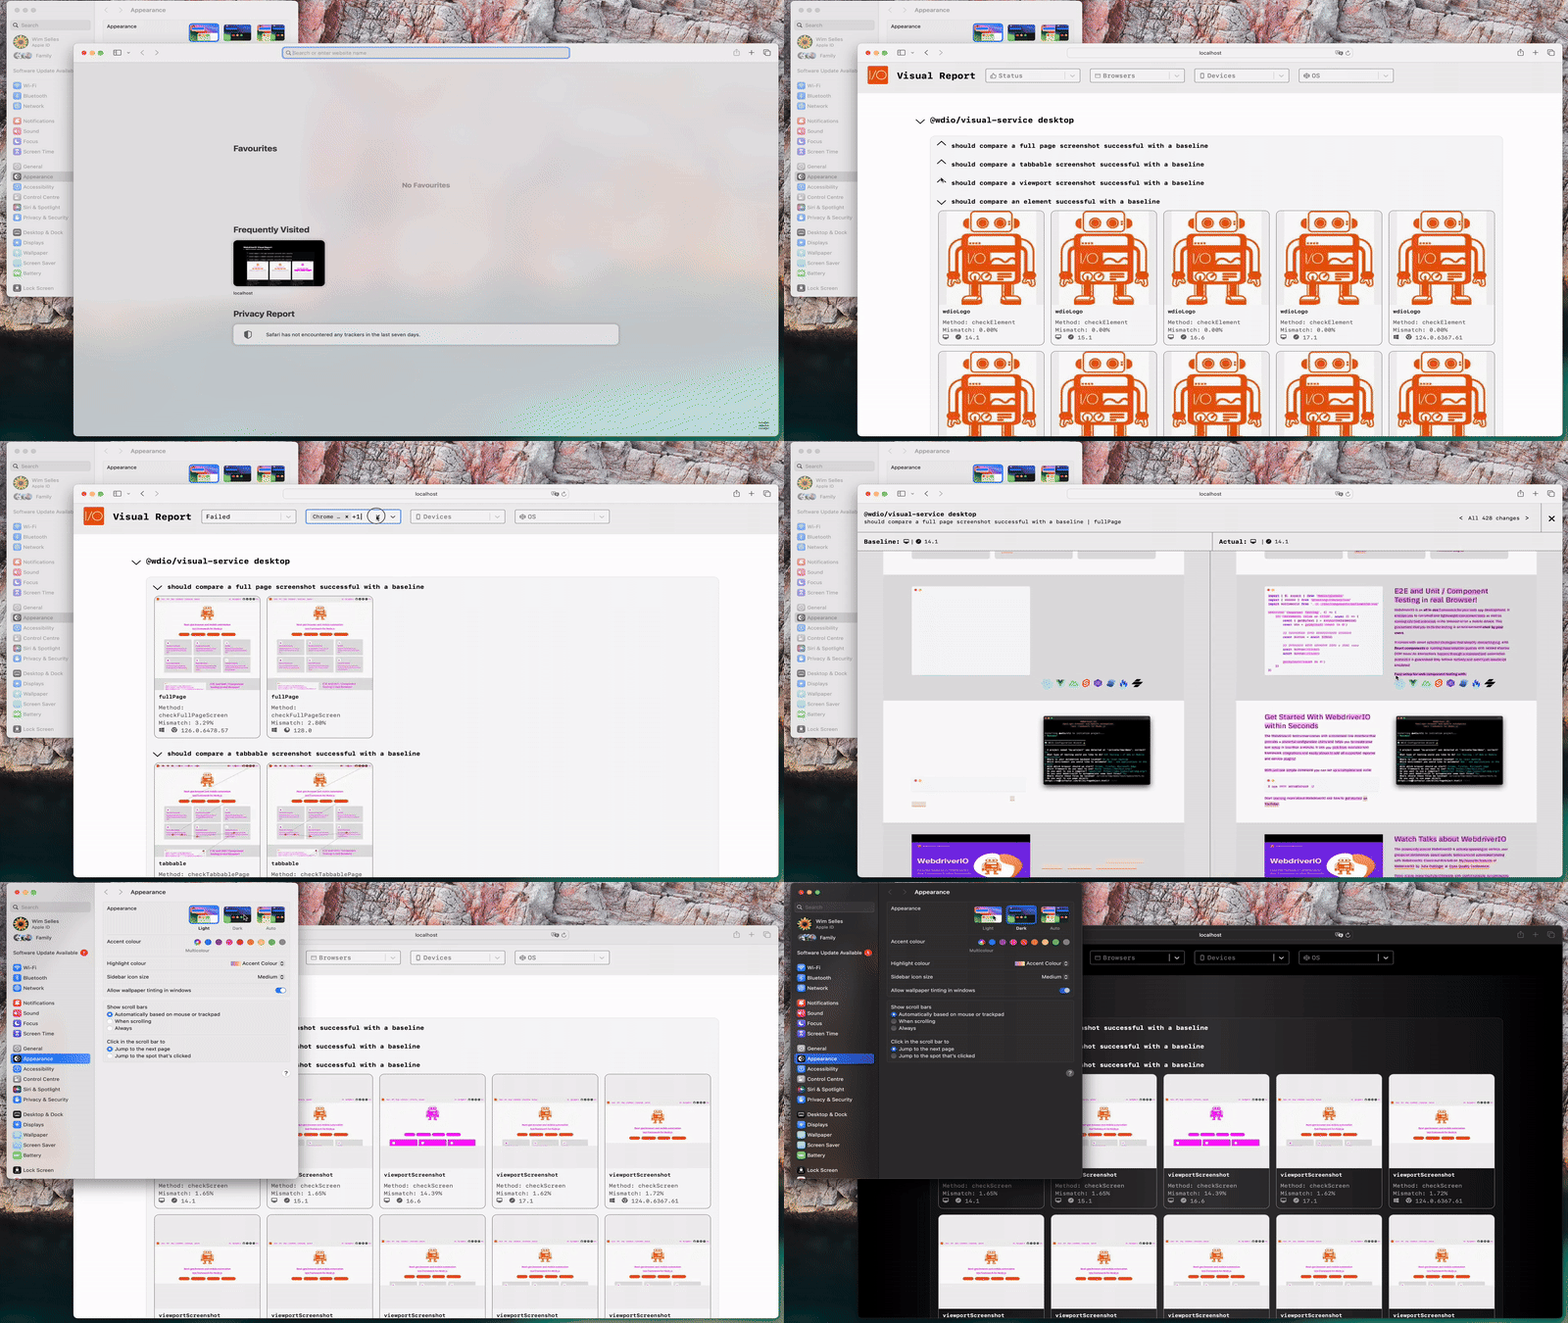
Візуальний репортер – це нова функція, представлена в @wdio/visual-service, починаючи з версії v5.2.0. Цей репортер дозволяє користувачам візуалізувати JSON-звіти про відмінності, створені службою візуального тестування, і перетворювати їх у зручний для людей формат. Він допомагає командам краще аналізувати та керувати результатами візуального тестування, надаючи графічний інтерфейс для перегляду вихідних даних.
Щоб використовувати цю функцію, переконайтеся, що у вас є необхідна конфігурація для створення потрібного файлу output.json. Цей документ проведе вас через налаштування, запуск та розуміння Візуального репортера.
Передумови
Перед використанням Візуального репортера переконайтеся, що ви налаштували службу візуального тестування для створення файлів звітів JSON:
export const config = {
    // ...
    services: [
        [
            "visual",
            {
                createJsonReportFiles: true, // Генерує файл output.json
            },
        ],
    ],
};
Для отримання більш детальних інструкцій з налаштування зверніться до документації WebdriverIO Візуальне тестування або createJsonReportFiles
Встановлення
Щоб встановити Візуальний репортер, додайте його як залежність для розробки до вашого проекту за допомогою npm:
npm install @wdio/visual-reporter --save-dev
Це забезпечить наявність необхідних файлів для створення звітів з ваших візуальних тестів.
Використання
Створення візуального звіту
Після запуску візуальних тестів і створення файлу output.json, ви можете створити візуальний звіт за допомогою CLI або інтерактивних підказок.
Використання CLI
Ви можете використовувати команду CLI для створення звіту, запустивши:
npx wdio-visual-reporter --jsonOutput=<шлях-до-output.json> --reportFolder=<шлях-для-зберігання-звіту> --logLevel=debug
Обов'язкові параметри:
--jsonOutput: Відносний шлях до файлуoutput.json, згенерованого службою візуального тестування. Цей шлях є відносним до каталогу, з якого ви виконуєте команду.--reportFolder: Відносний каталог, де буде зберігатися згенерований звіт. Цей шлях також є відносним до каталогу, з якого ви виконуєте команду.
Додаткові параметри:
--logLevel: Встановіть значенняdebugдля отримання детального логування, особливо корисного для усунення неполадок.
Приклад
npx wdio-visual-reporter --jsonOutput=/path/to/output.json --reportFolder=/path/to/report --logLevel=debug
Це створить звіт у вказаній папці та надасть зворотний зв'язок у консолі. Наприклад:
✔ Build output copied successfully to "/path/to/report".
⠋ Prepare report assets...
✔ Successfully generated the report assets.
Перегляд звіту
Відкриття path/to/report/index.html безпосередньо в браузері без запуску з локального сервера НЕ працюватиме.
Для перегляду звіту вам потрібно використовувати простий сервер, наприклад sirv-cli. Ви можете запустити сервер за допомогою такої команди:
npx sirv-cli /path/to/report --single
Це створить журнали, подібні до прикладу нижче. Зауважте, що номер порту може відрізнятися:
  Your application is ready~! 🚀

  - Local:      http://localhost:8080
  - Network:    Add `--host` to expose

────────────────── LOGS ──────────────────
Тепер ви можете переглянути звіт, відкривши наданий URL у вашому браузері.
Використання інтерактивних підказок
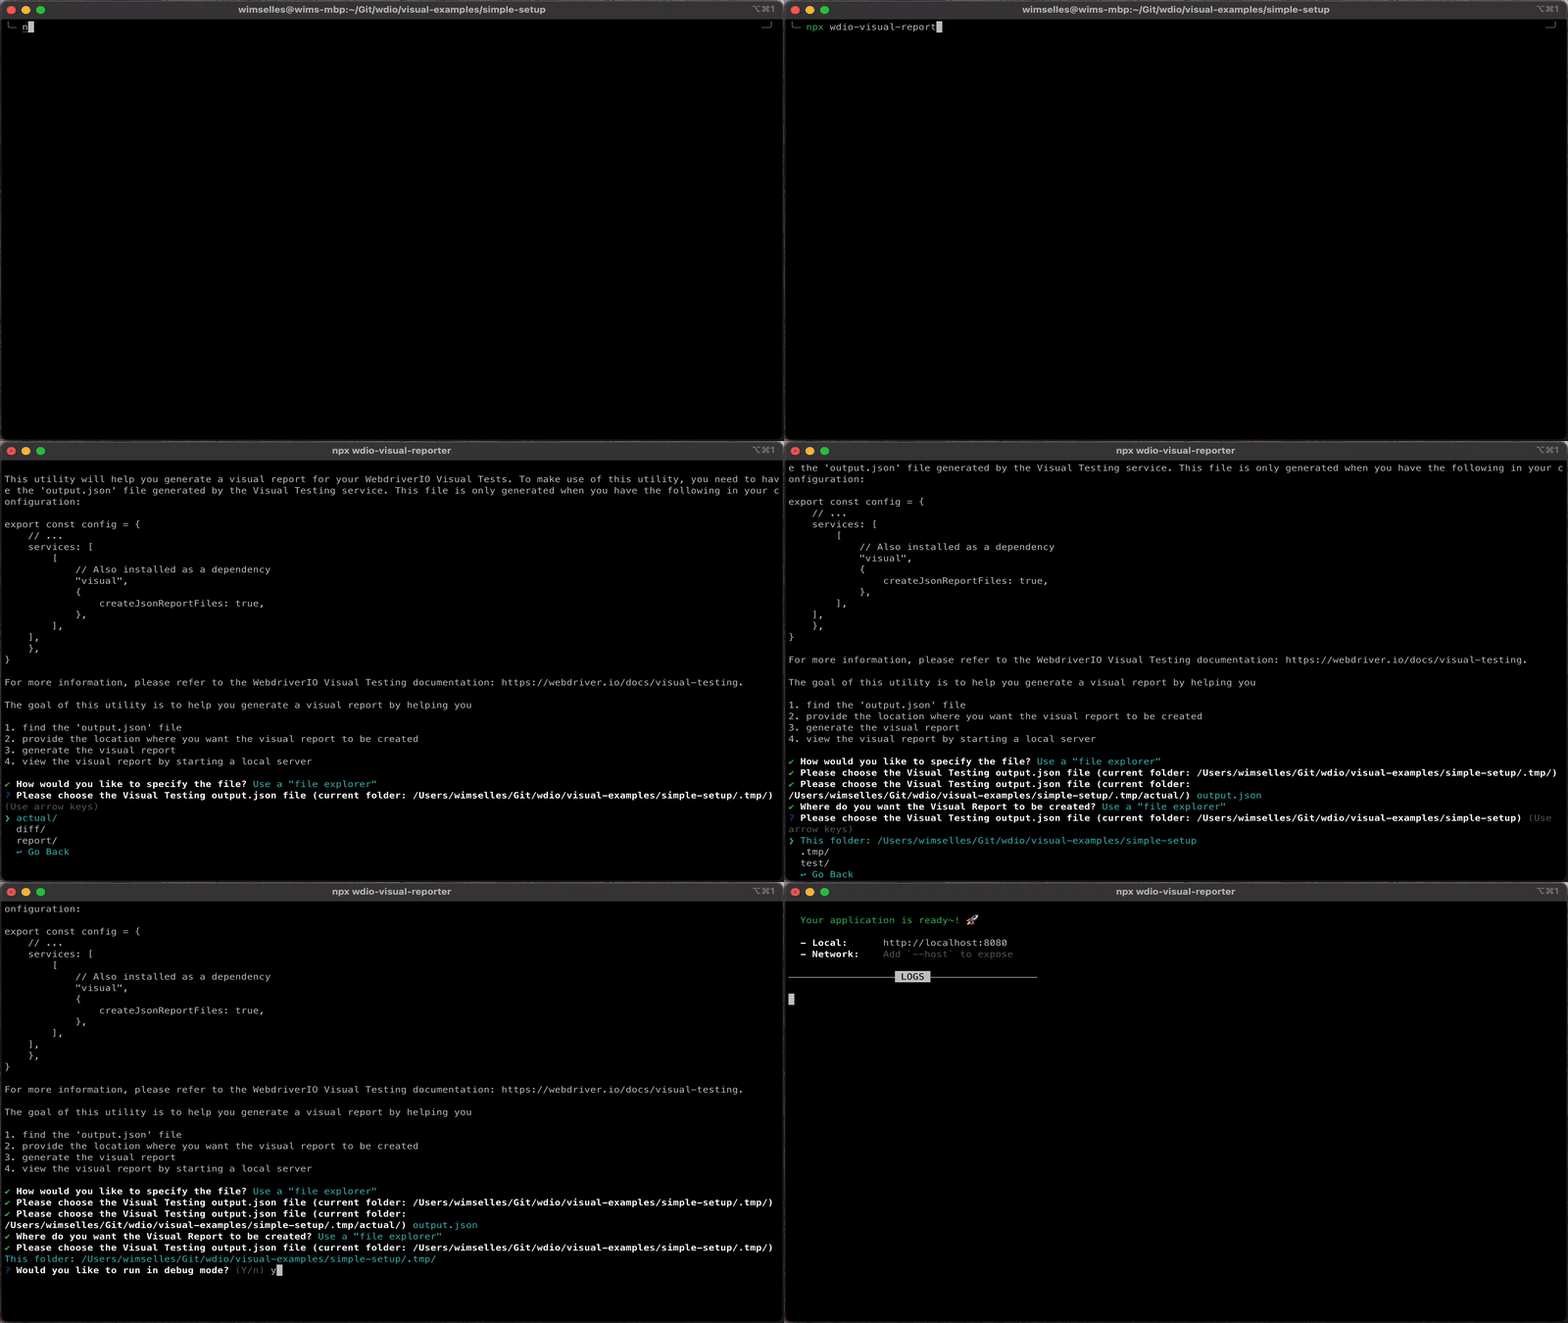
Альтернативно, ви можете запустити наступну команду і відповісти на підказки для створення звіту:
npx @wdio/visual-reporter
Підказки проведуть вас через надання необхідних шляхів та параметрів. Наприкінці інтерактивна підказка також запитає, чи хочете ви запустити сервер для перегляду звіту. Якщо ви обираєте запустити сервер, інструмент запустить простий сервер і відобразить URL у журналах. Ви можете відкрити цей URL у вашому браузері для перегляду звіту.


Перегляд звіту
Відкриття path/to/report/index.html безпосередньо в браузері без запуску з локального сервера НЕ працюватиме.
Якщо ви вирішили не запускати сервер через інтерактивну підказку, ви все ще можете переглянути звіт, виконавши таку команду вручну:
npx sirv-cli /path/to/report --single
Це створить журнали, подібні до прикладу нижче. Зауважте, що номер порту може відрізнятися:
  Your application is ready~! 🚀

  - Local:      http://localhost:8080
  - Network:    Add `--host` to expose

────────────────── LOGS ──────────────────
Тепер ви можете переглянути звіт, відкривши наданий URL у вашому браузері.
Демонстрація звіту
Щоб побачити приклад того, як виглядає звіт, відвідайте наш демо-сайт на GitHub Pages.
Розуміння візуального звіту
Візуальний репортер надає організований вигляд результатів ваших візуальних тестів. Для кожного запуску тесту ви зможете:
- Легко переміщатися між тестовими випадками та бачити зведені результати.
- Переглядати метадані, такі як назви тестів, використовувані браузери та результати порівняння.
- Переглядати зображення з різницею, що показують, де було виявлено візуальні відмінності.
Це візуальне представлення спрощує аналіз результатів ваших тестів, полегшуючи виявлення та вирішення візуальних регресій.
Інтеграції з CI
Ми працюємо над підтримкою різних інструментів CI, таких як Jenkins, GitHub Actions тощо. Якщо ви хочете допомогти нам, будь ласка, зв'яжіться з нами в Discord - Visual Testing.
